Dashboards at every level
Each level opens on a dashboard that answers "is everything fine here?" at its own scale.
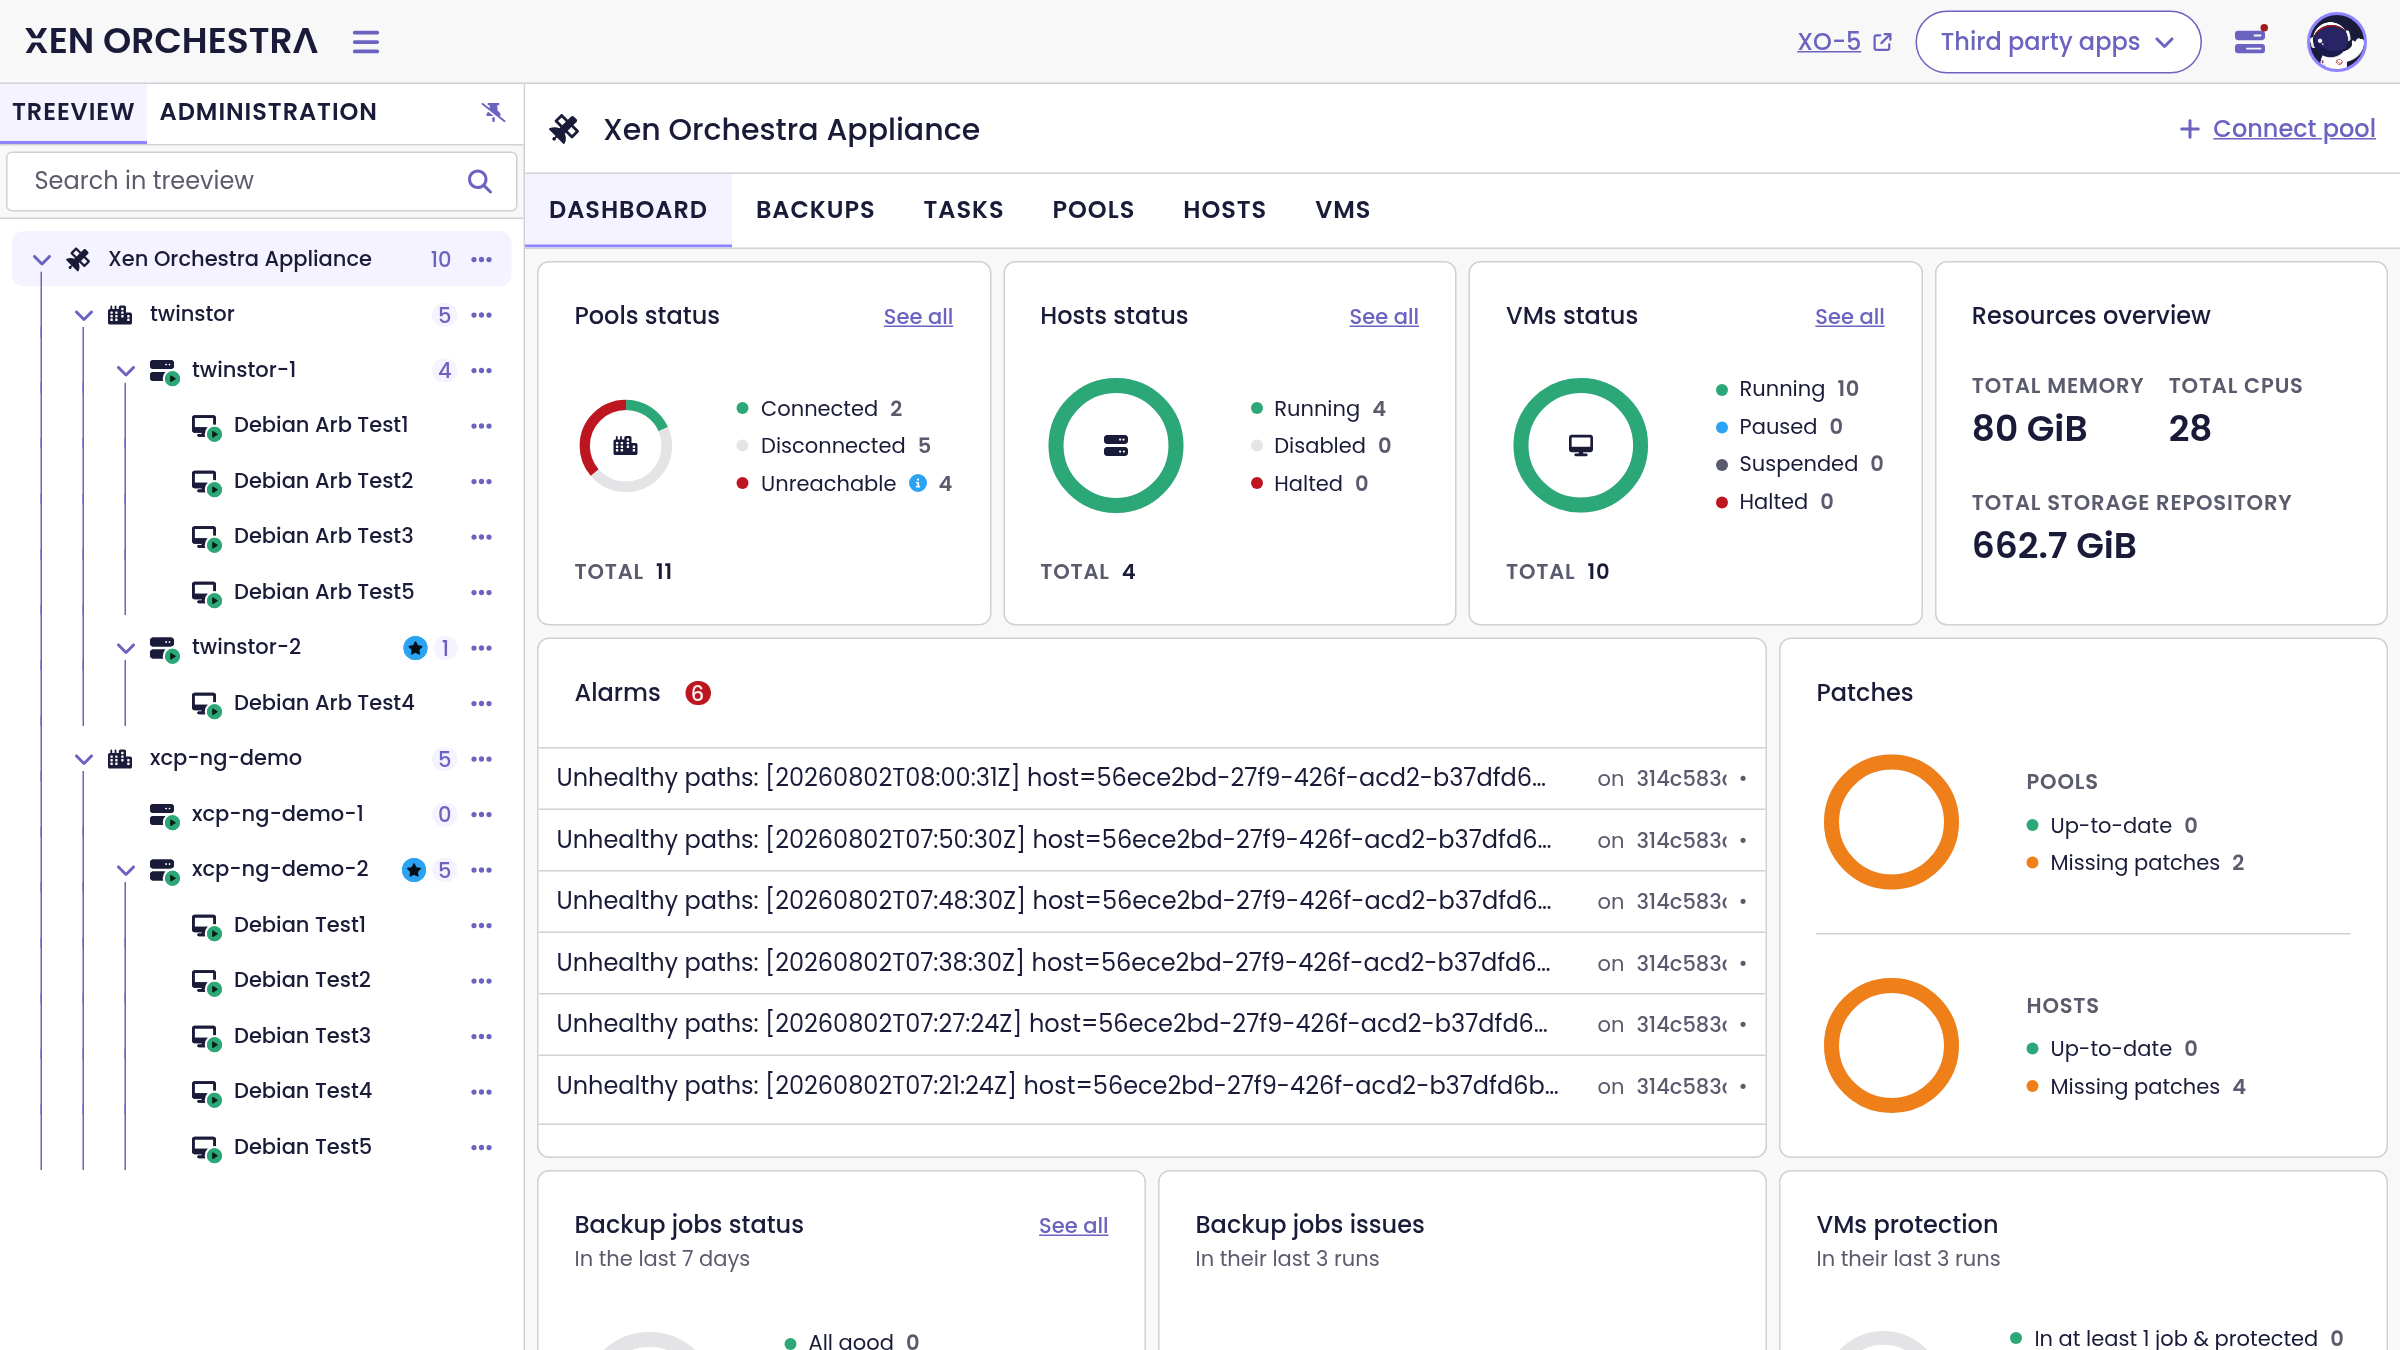
At the top level, the dashboard aggregates the whole infrastructure: pool, host and VM status, total memory, CPUs and storage, alarms, missing patches per pool and host, backup job health and how many VMs are protected by a backup job:
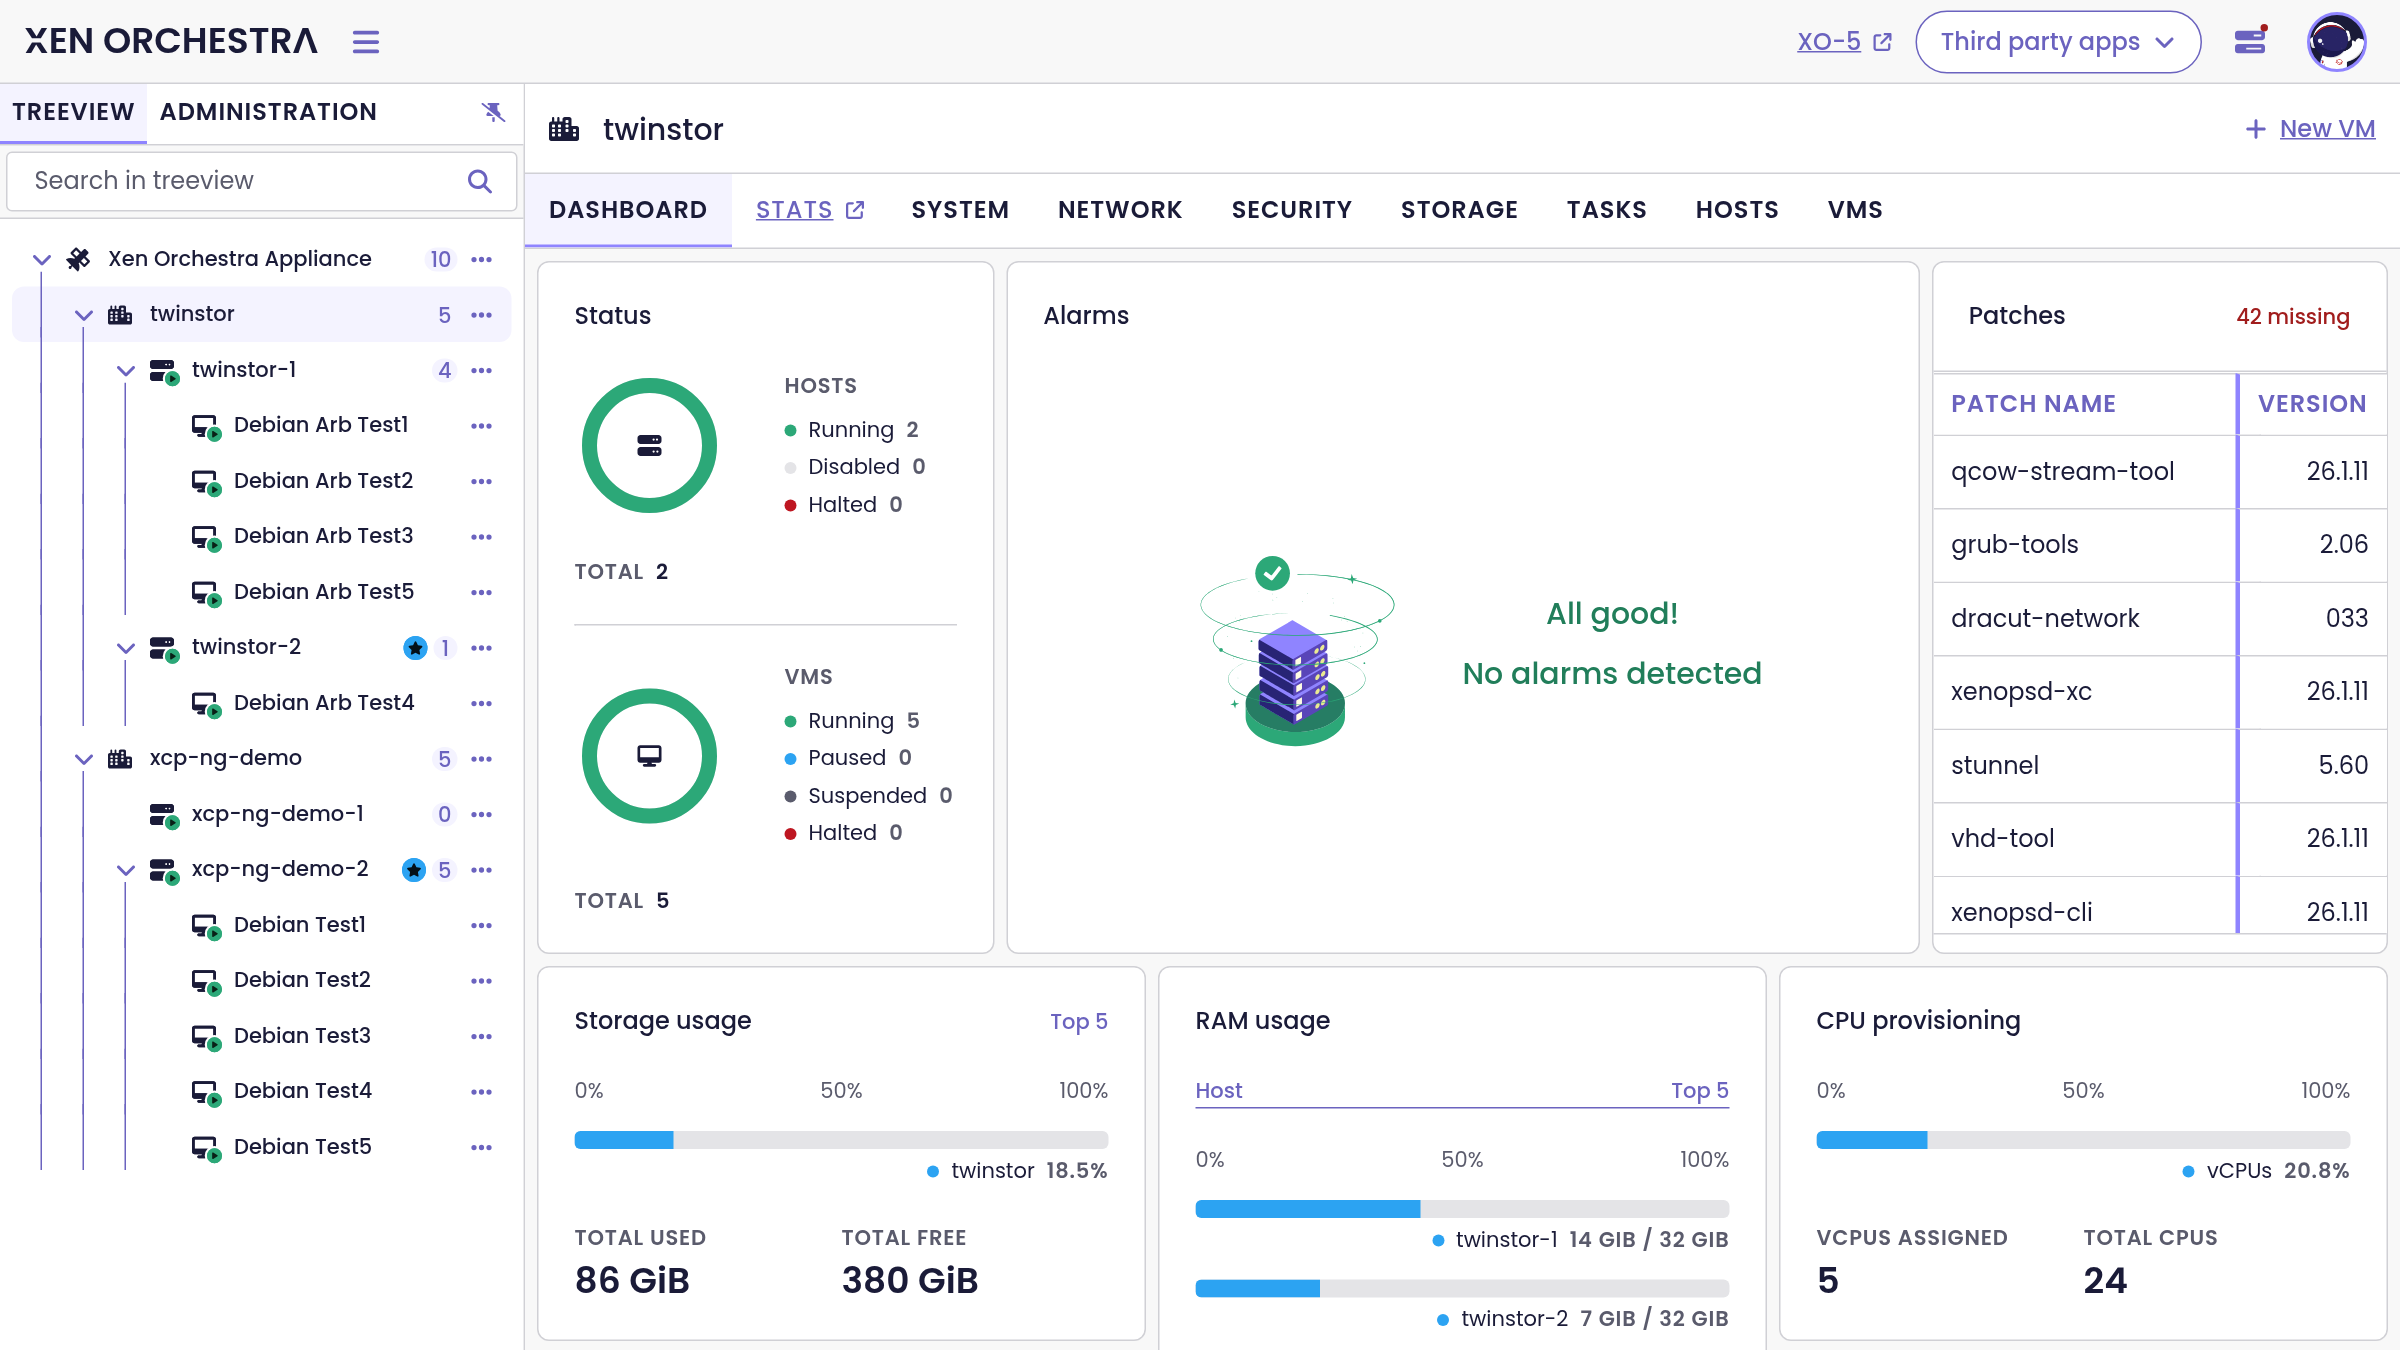
At the pool level, the same layout narrows to the pool: host and VM status, alarms, the exact list of missing patches, storage and RAM usage per host, and CPU provisioning:
Host and VM dashboards follow the same principle, down to the quick info of a single VM (state, IP address reported by the guest tools, OS, vCPUs, RAM, virtualization mode) and its individual backup protection status.
Was this page helpful?