Core concepts
XO 6 organizes everything around a simple idea: every level of your infrastructure gets the same treatment. Your whole Xen Orchestra, a pool, a host or a single VM each have their own page, with a dashboard and a consistent set of tabs. Once you know how one page works, you know them all.
The object hierarchy
Xen Orchestra manages any number of pools, wherever they are:
- Xen Orchestra (the top level): everything connected to this XO, across all pools and sites.
- Pool: a group of XCP-ng hosts sharing storage and networks, managed as one unit.
- Host: an XCP-ng server inside a pool.
- VM: a virtual machine running on a host.
The tree view on the left mirrors this hierarchy, and every page shows its object's place in it (a VM page links to its host and pool, and so on).
Dashboards at every level
Each level opens on a dashboard that answers "is everything fine here?" at its own scale.
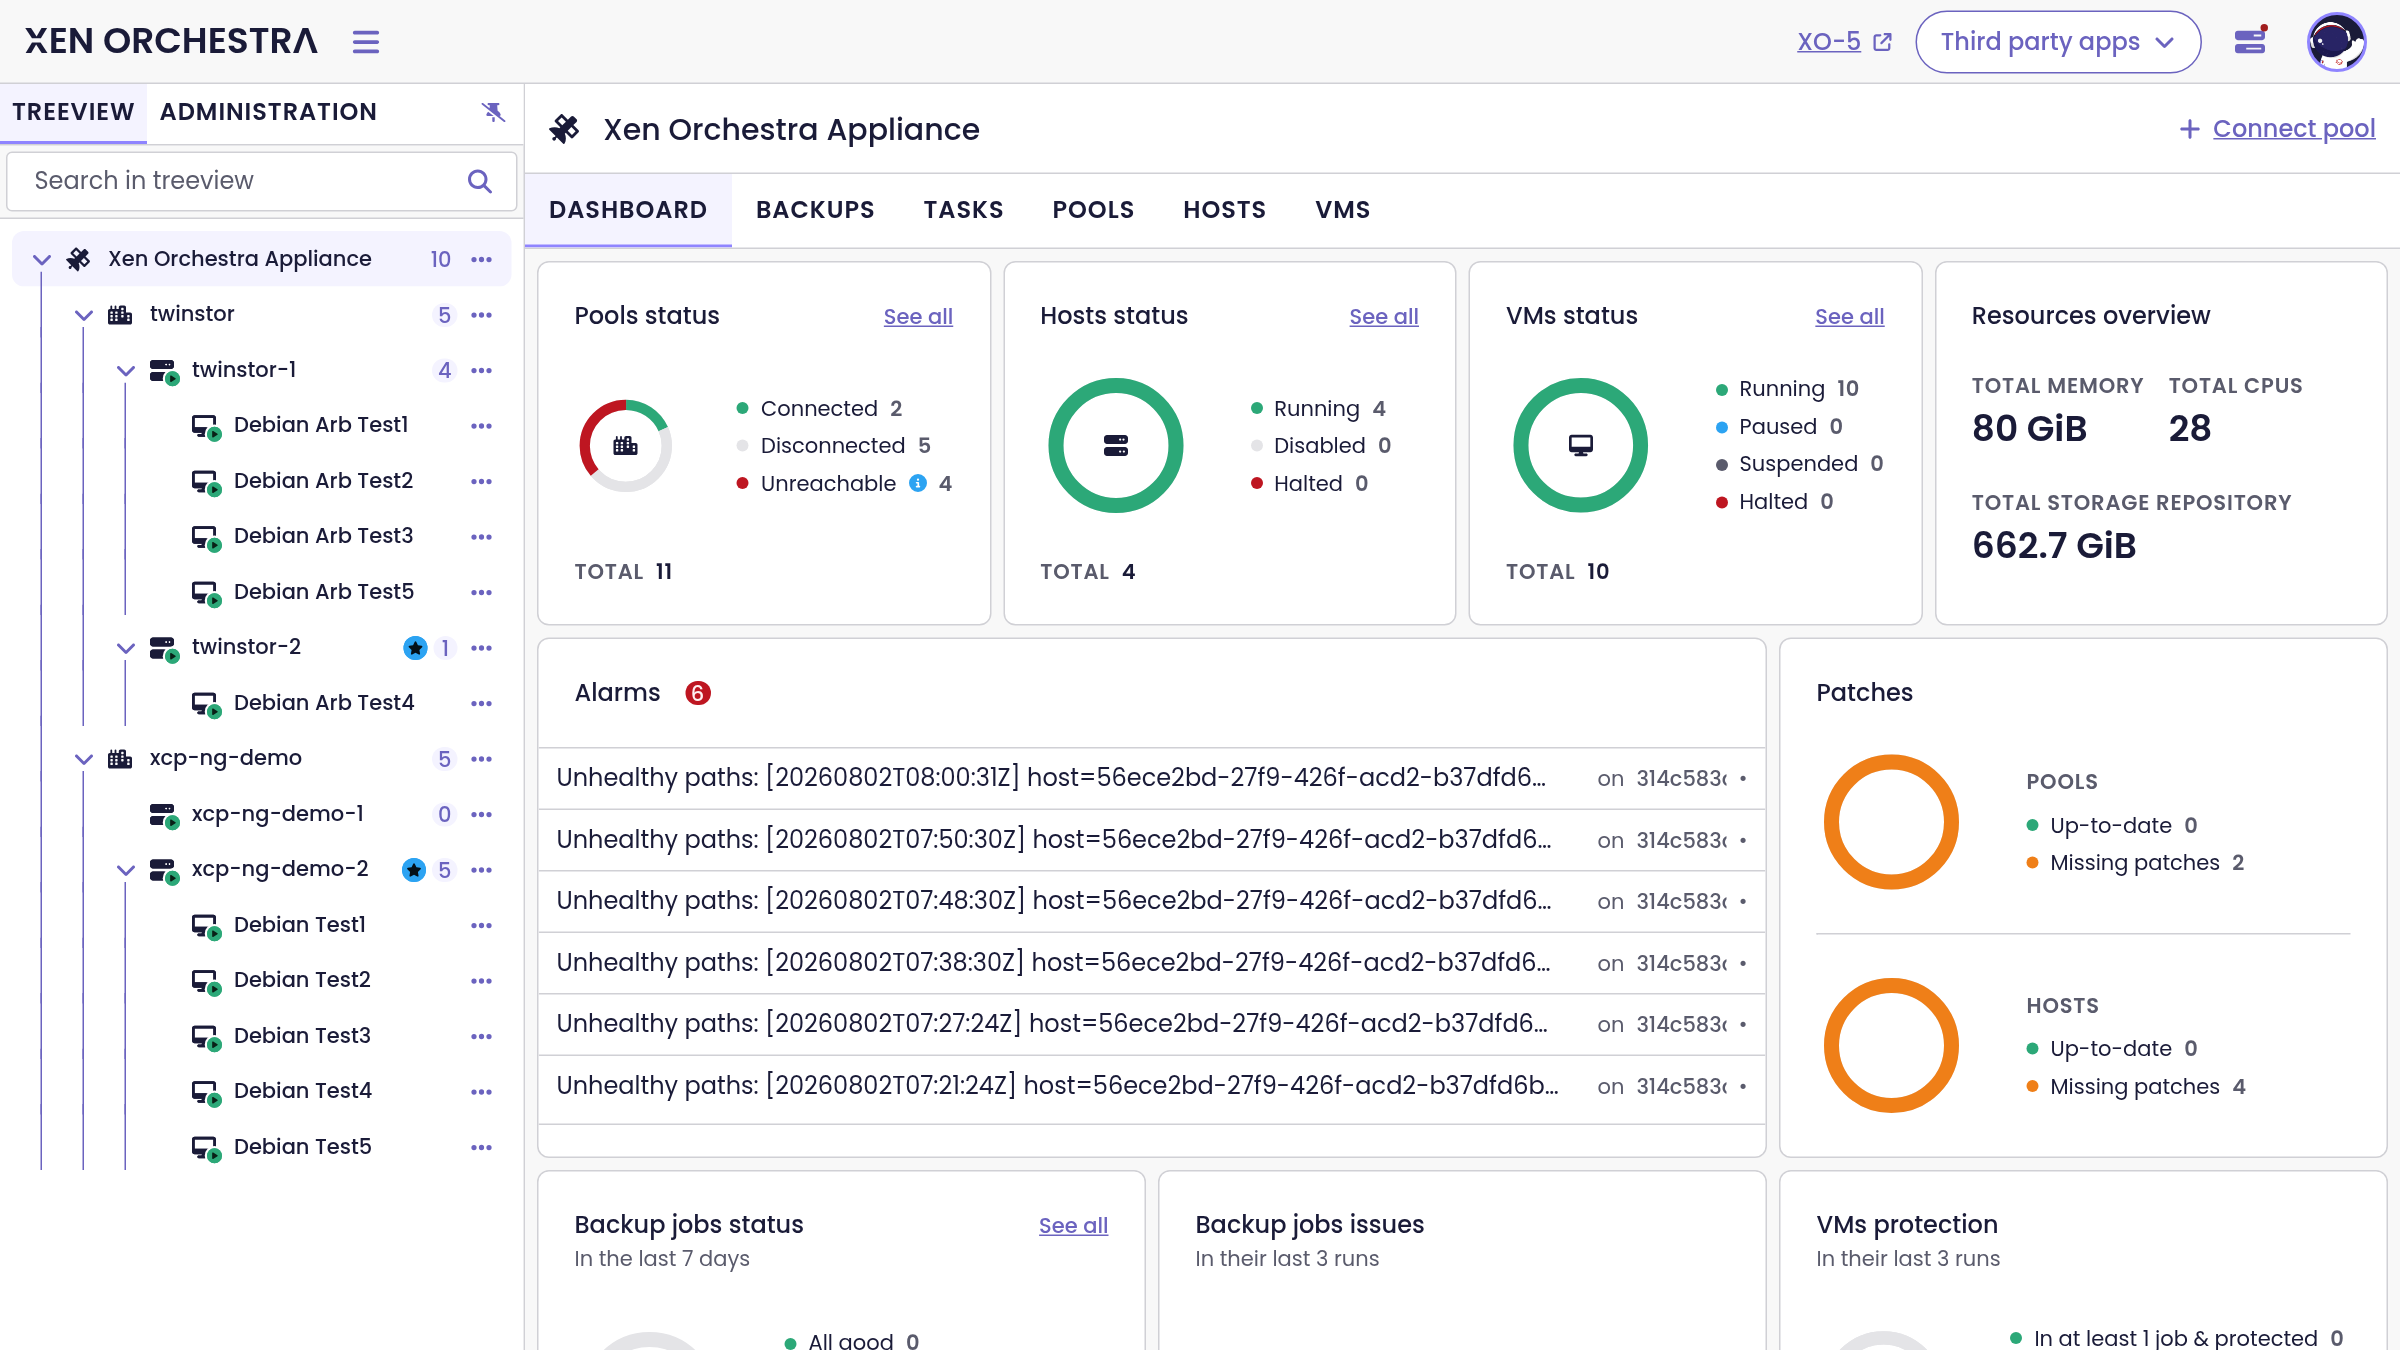
At the top level, the dashboard aggregates the whole infrastructure: pool, host and VM status, total memory, CPUs and storage, alarms, missing patches per pool and host, backup job health and how many VMs are protected by a backup job:
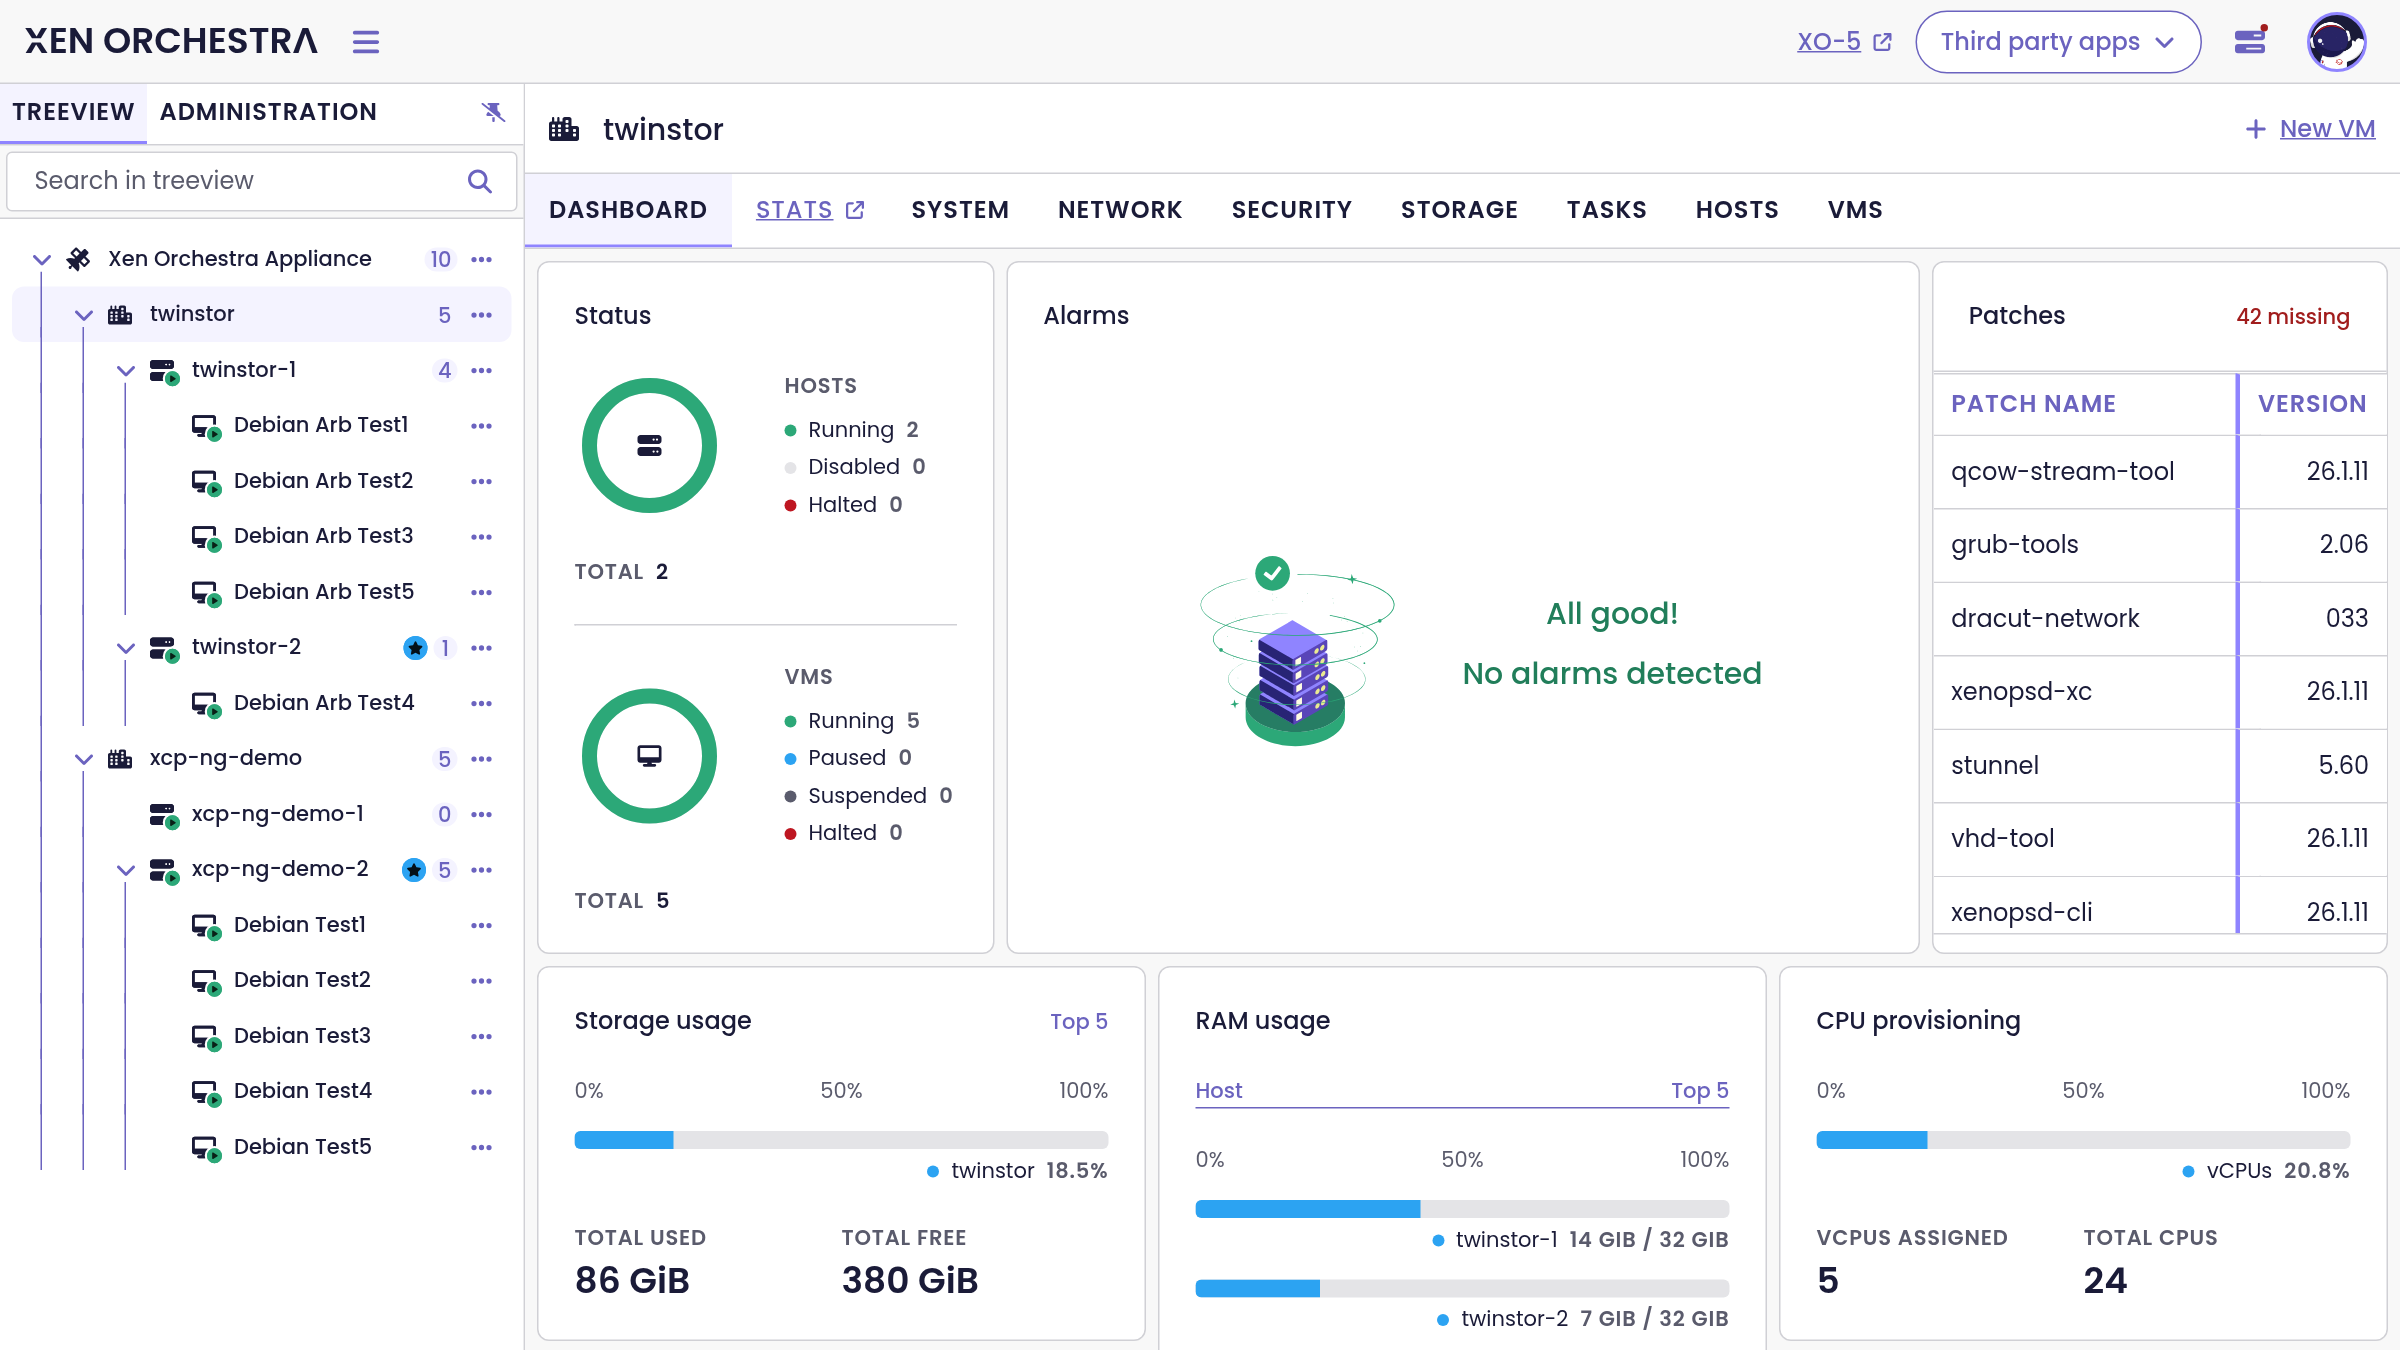
At the pool level, the same layout narrows to the pool: host and VM status, alarms, the exact list of missing patches, storage and RAM usage per host, and CPU provisioning:
Host and VM dashboards follow the same principle, down to the quick info of a single VM (state, IP address reported by the guest tools, OS, vCPUs, RAM, virtualization mode) and its individual backup protection status.
Tabs, tables and the side panel
Object pages are organized in tabs. The exact set depends on the object:
| Level | Tabs |
|---|---|
| Xen Orchestra | Dashboard, Backups, Tasks, Pools, Hosts, VMs |
| Pool | Dashboard, Stats, System, Network, Security, Storage, Tasks, Hosts, VMs |
| Host | Dashboard, Console, Stats, System, Network, Storage, Tasks, VMs |
| VM | Dashboard, Console, Backups, Stats, System, Network, VDIs, Snapshots, Tasks |
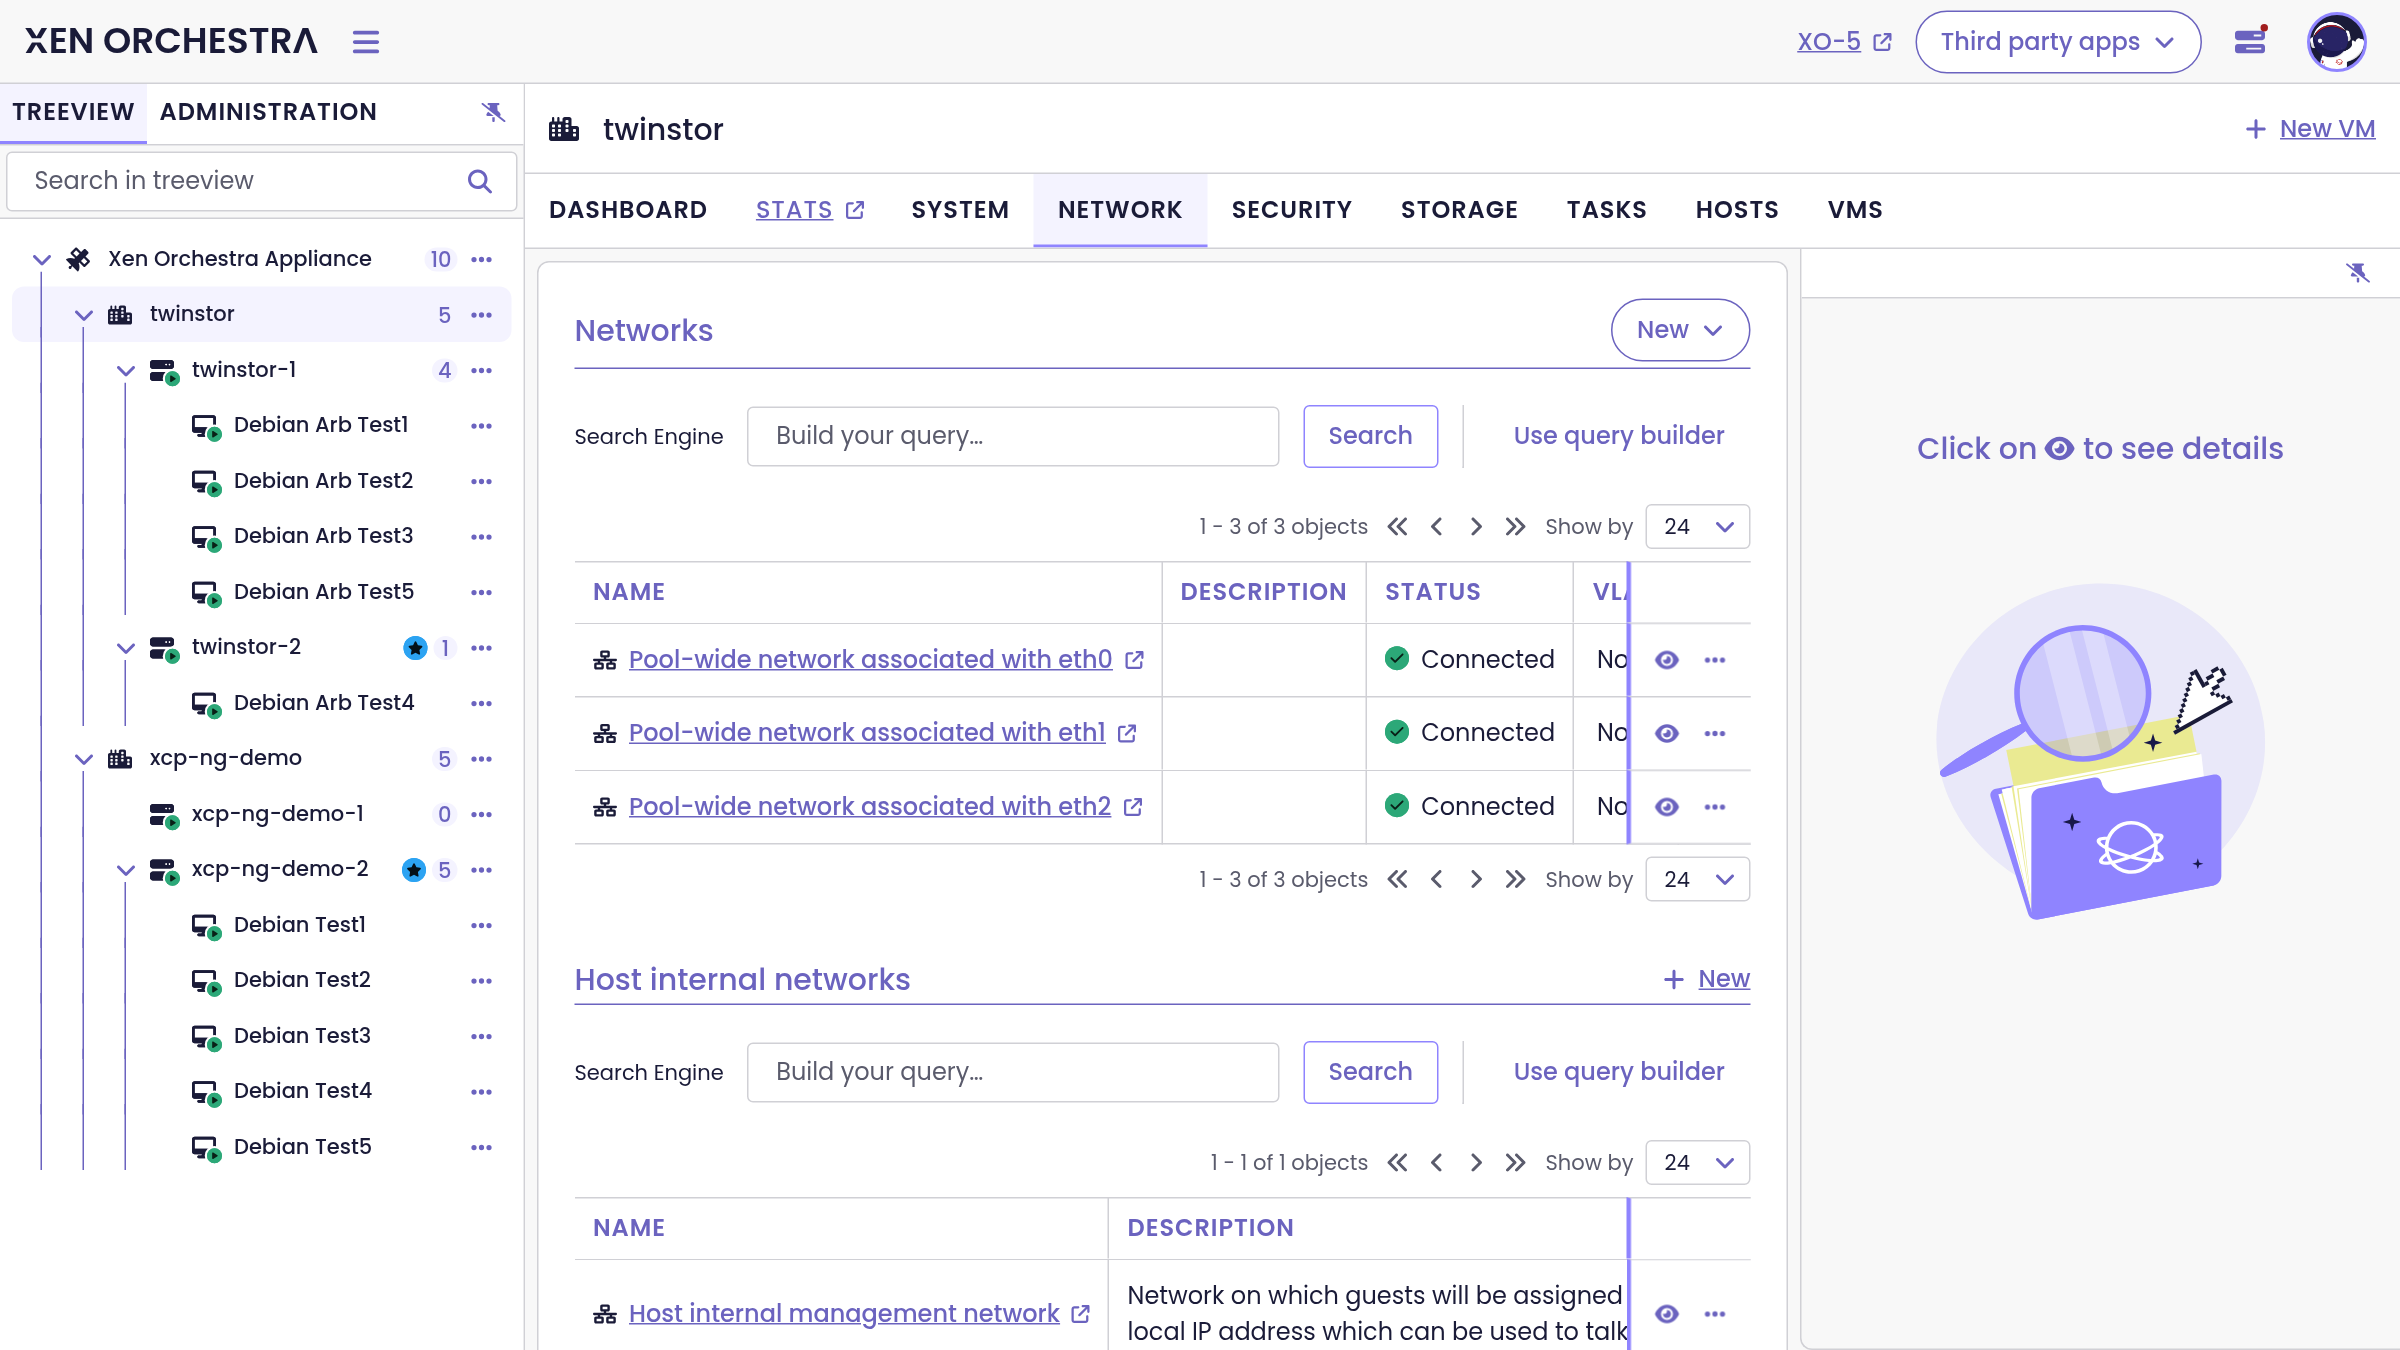
Tables (networks, tasks, backup jobs, snapshots and so on) share the same tooling everywhere:
- a Search Engine field with a query builder, to filter large tables precisely,
- pagination controls,
- an eye icon per row that opens the side panel with the details of that row, so you never lose the context of the list.
Tasks: everything is tracked
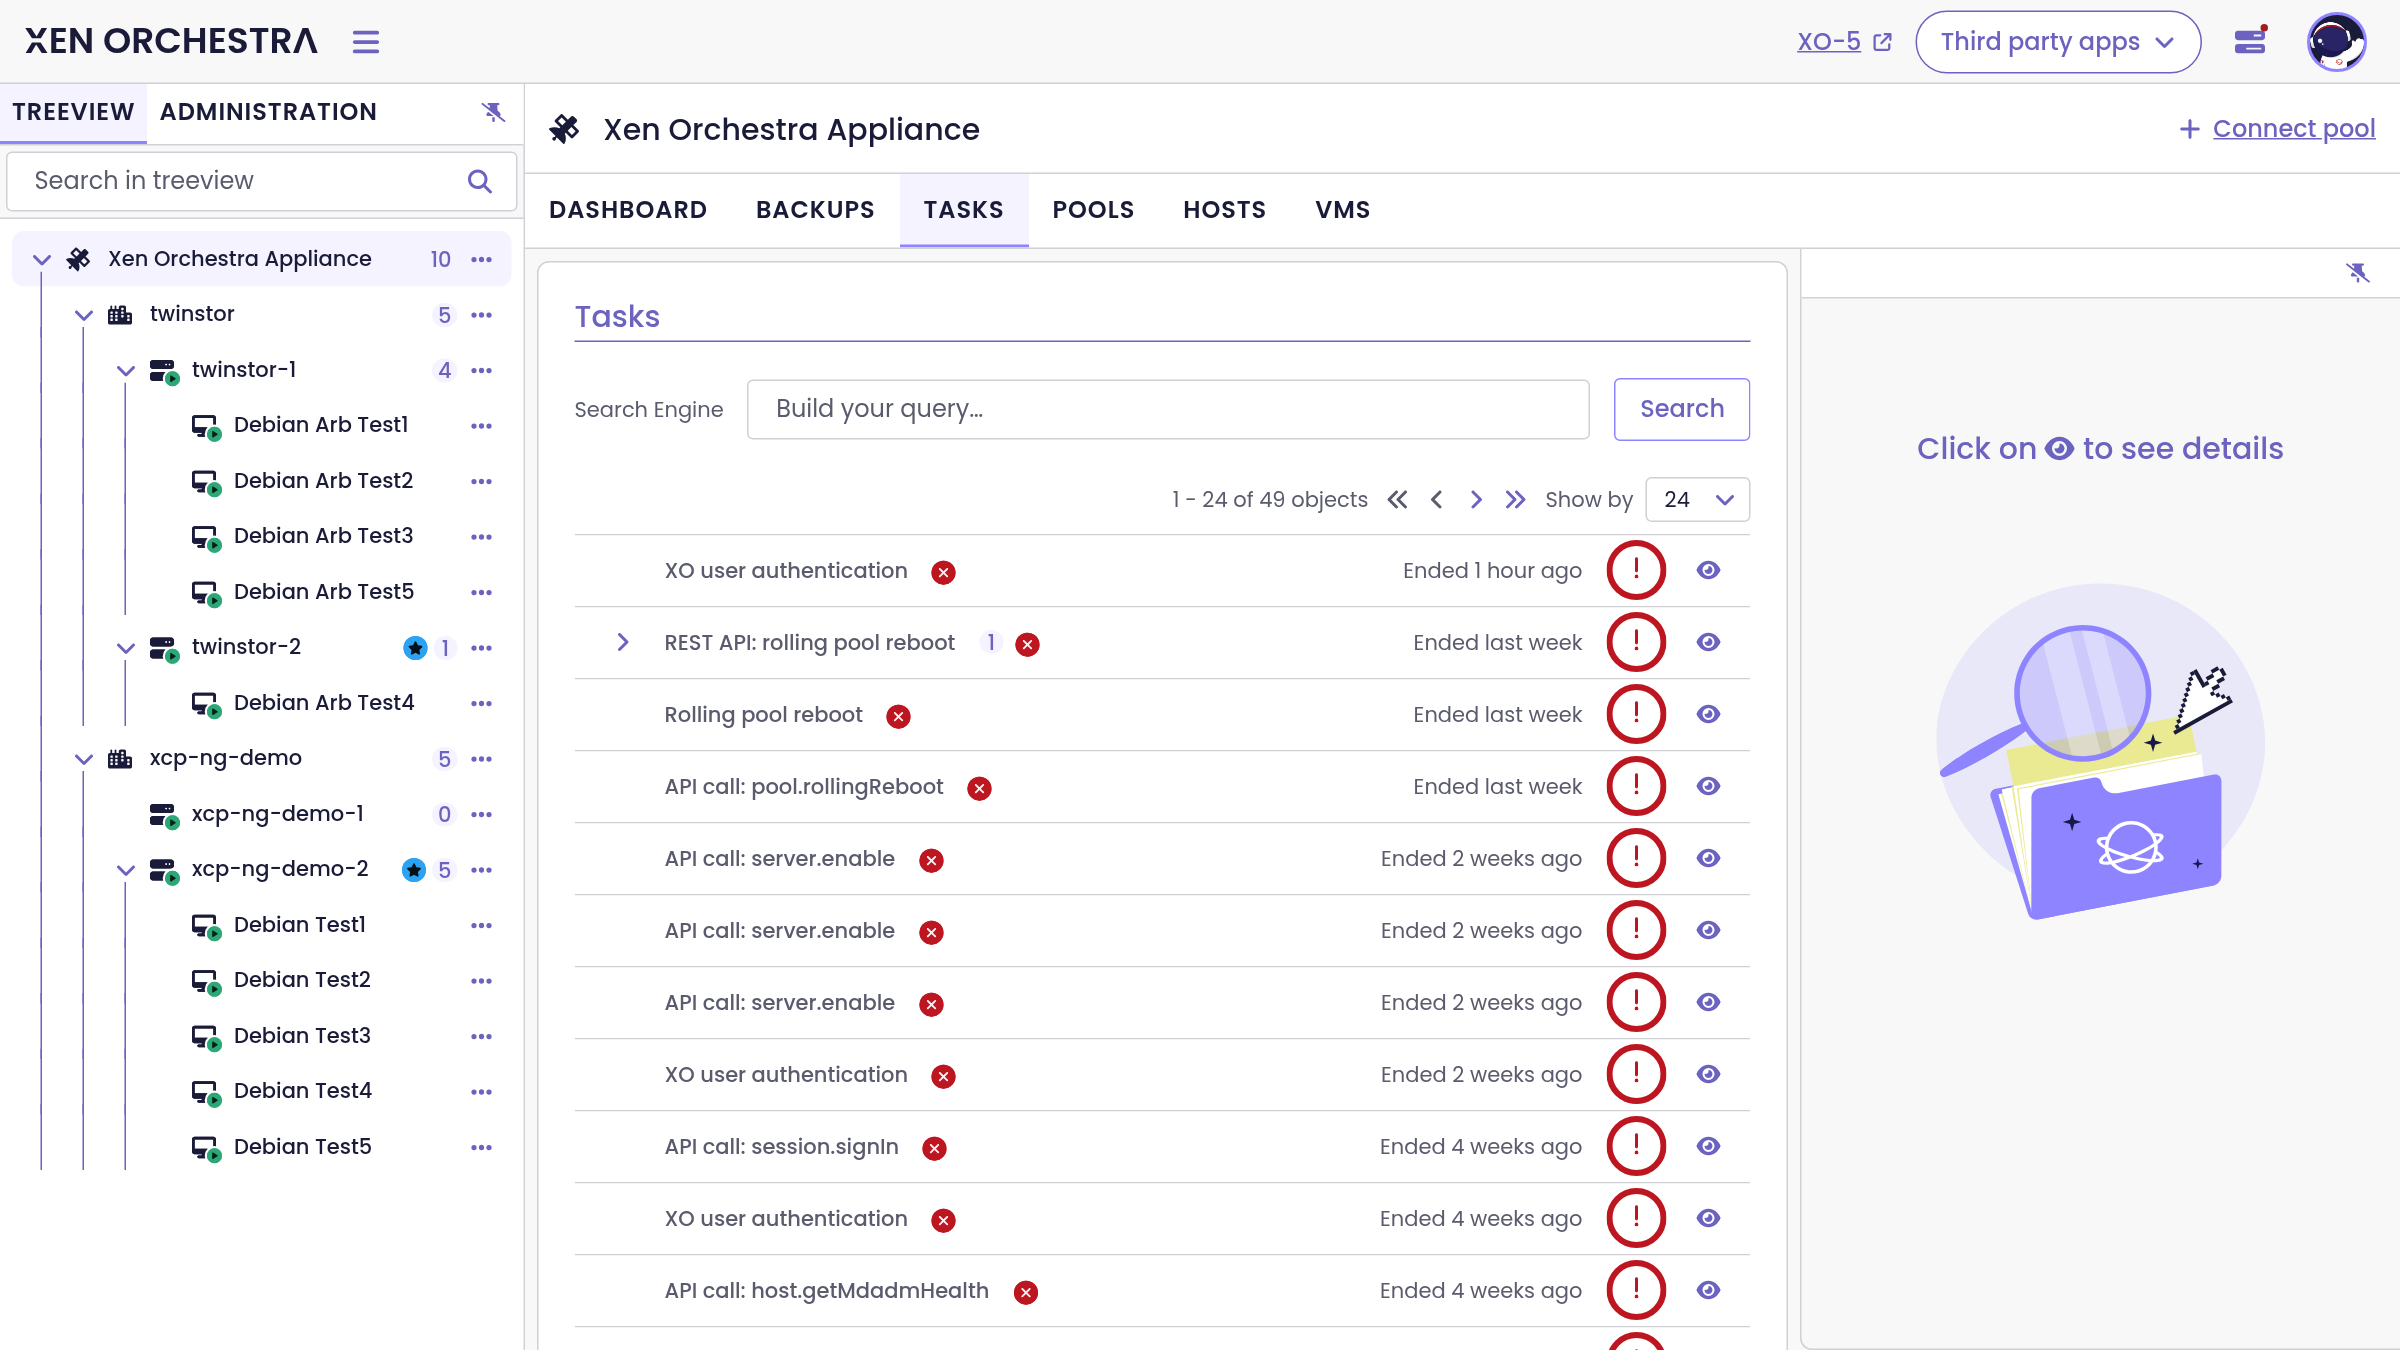
Every level has a Tasks tab. It records what happens on your infrastructure: user authentications, API calls, rolling pool reboots, backup runs and any other operation, with their outcome and when they ended. When you need to understand what happened and when, start there.
Where XO 5 fits
XO 6 is an official release under active development. A few operations still live in XO 5, and XO 6 tells you explicitly: buttons and links marked with an external-link icon (for example Manage VM lifecycle in XO 5, or the Stats tab) open the right XO 5 page for that same object. Both interfaces work on the same data at the same time, so there is no synchronization to think about. The current split is documented in XO 6 vs. XO 5.